
Excel and Power BI are data analysis tools that overlap in some areas but have distinct advantages in others.
Yet, if you haven't used either before, it can be a conundrum choosing between them for your work.
In essence, Excel is a spreadsheet program used to organise, transform, and calculate data. Whereas Power BI is a data visualisation program for creating interactive dashboards, reports, and data models.
However, when should one be used over the other? Let's have a look at a few differences.
1. Flexibility
Nothing beats the anything-anywhere approach of Excel. A worksheet is effectively a blank canvas that gives users carte blanche from the get-go. They can input cell data, construct formulas, and generate charts within minutes. The Power BI canvas is comparatively more restrictive and has a steeper learning curve.
2. Data size
Power BI naturally handles far bigger datasets than Excel, as the latter is restricted to roughly a million worksheet rows. To caveat that, however, it is possible to load bigger datasets in Excel via the Data Model, which can then be used with Power Pivot to generate PivotTables and PivotCharts.
3. Visualisations
Power BI has a greater range of visuals than Excel and even has a marketplace full of downloadable charts and graphs. However, with a bit of effort, there are innovative ways to customise the built-in Excel ones, as well as relying on add-ins.
4. Interactivity
Excel has date slicers, button slicers, and timelines. However, Power BI's have greater customisation and include cross filters, visual level filters, report level filters, and drillthrough filters.
5. Mobile accessibility
Excel can be used on mobile devices, but Power BI users are able to create user-friendly custom views of their reports.
6. Alerts
Power BI allows users to set up conditions that trigger mobile alerts if met. This is useful for quickly becoming aware of an important value change on the move.
Conclusion
Ultimately, the choice you make comes down to your preference and the nature of your work.
There are far more Excel users than Power BI, and people familiar with Excel are likelier to stick with it.
Regardless, it's not a case of using one or the other exclusively. It's always worth considering your options if one tool is more suitable for certain tasks.
Do you use both programs? If so, are there any features in Power BI you'd like in Excel or vice-versa? Let us know!

Latest Articles
.png)
Sheetcast - A Natural Evolution for People Who Love Excel
.png)
How to Build Your First AI Agent in Excel
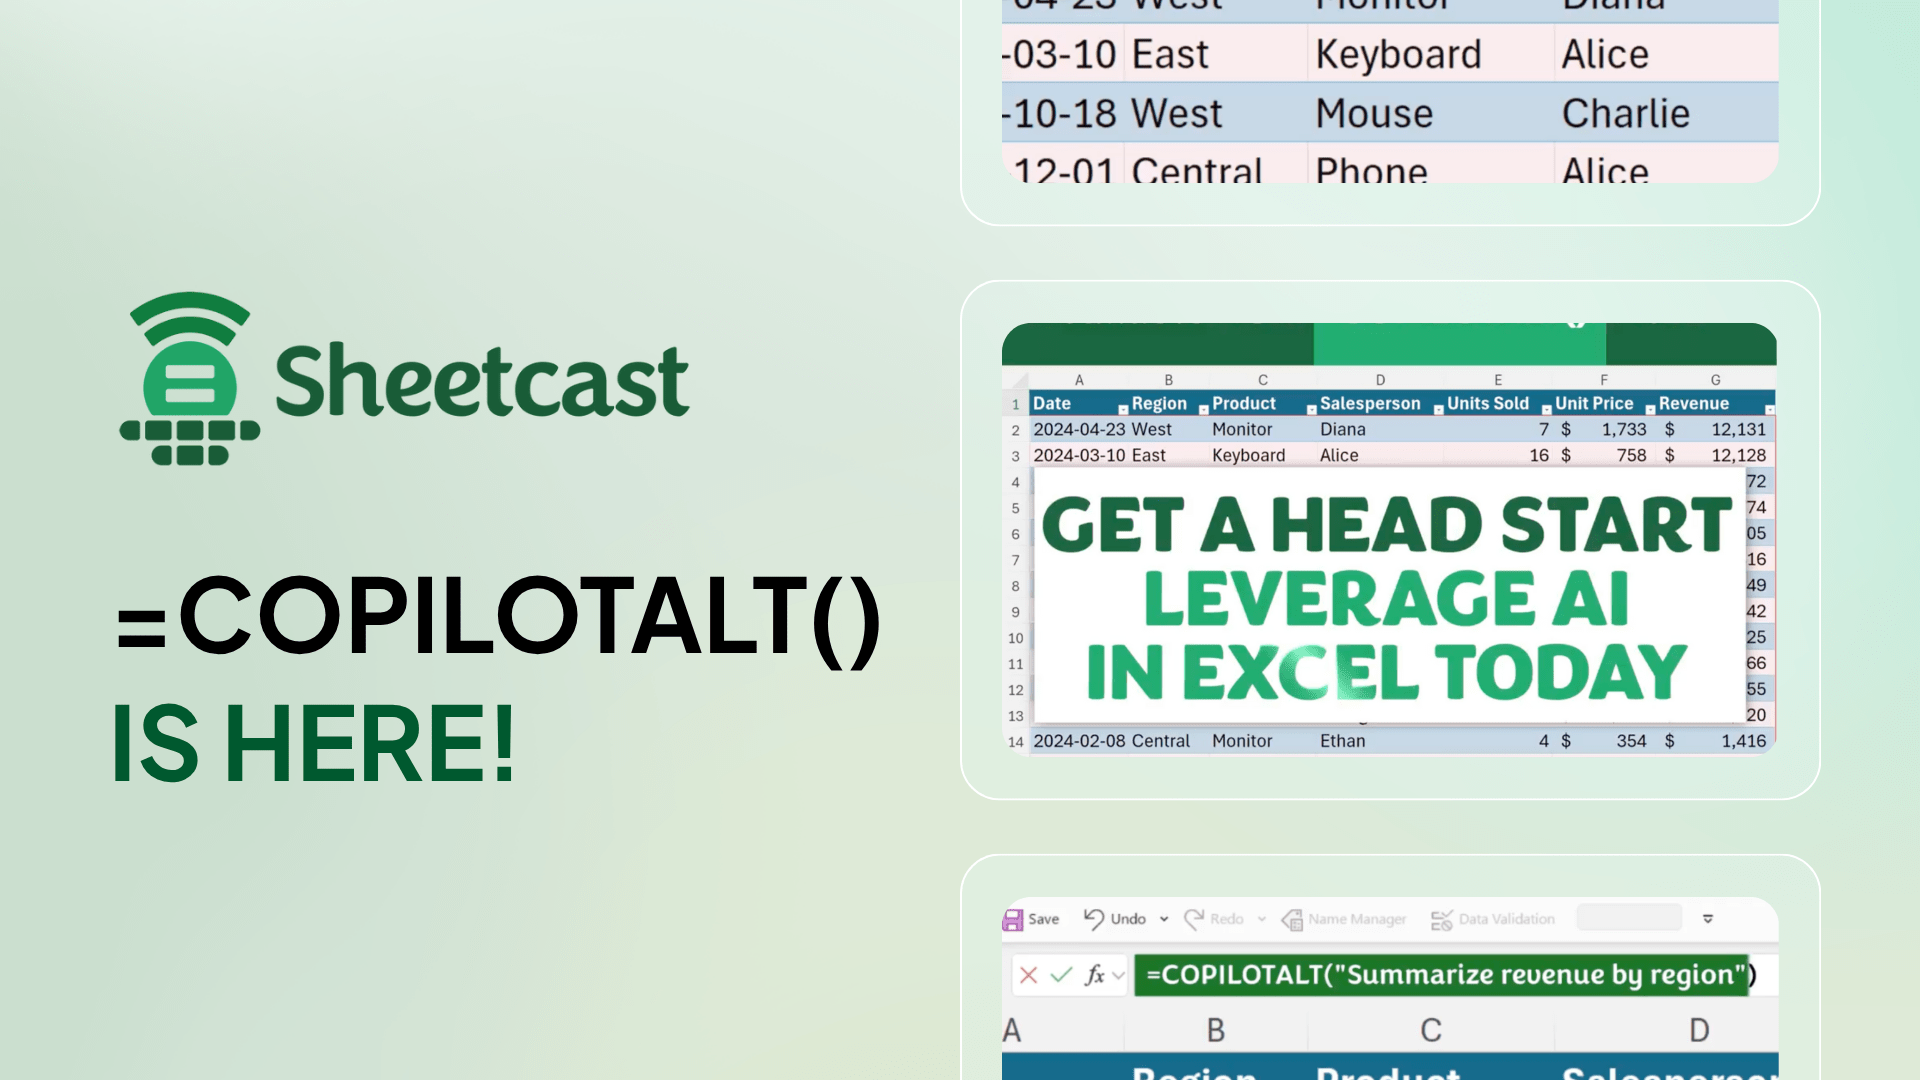
Leap into Excel’s AI revolution with COPILOTALT by Sheetcast
Join the Master Club
Your exclusive all-access pass to our entire digital learning experience for a whole year.
.png)