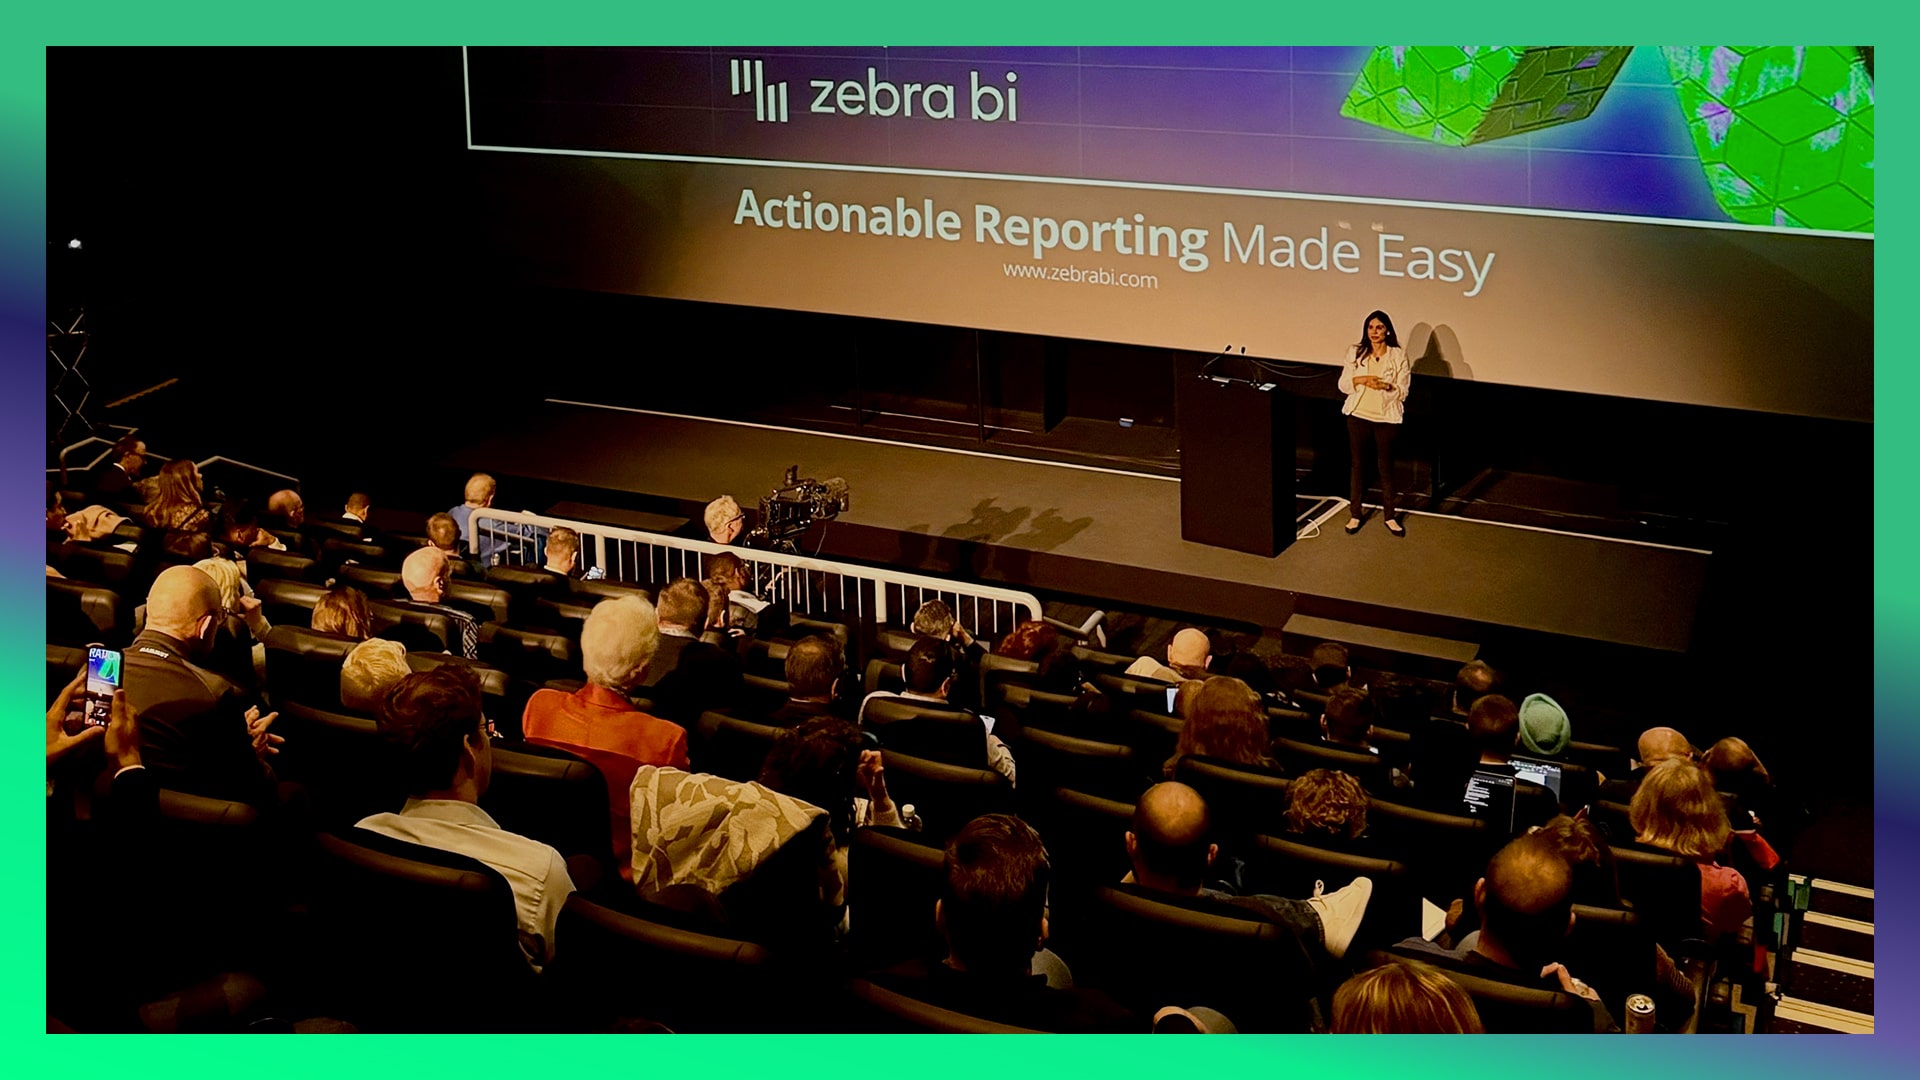
How to create an intuitive analytic experience in Excel using Script Labs
7 Feb
11:00 am
-
11:15 am
About the session
Discover how to create a visual app interface in Excel using Microsoft's new Script Lab and Excel Lab tool sets. You'll learn how to leverage Excel's powerful functions such as Dynamic Arrays, LAMBDA, generative AI and ChatGPT in new and innovative ways to transform financial modelling and analysis.


