
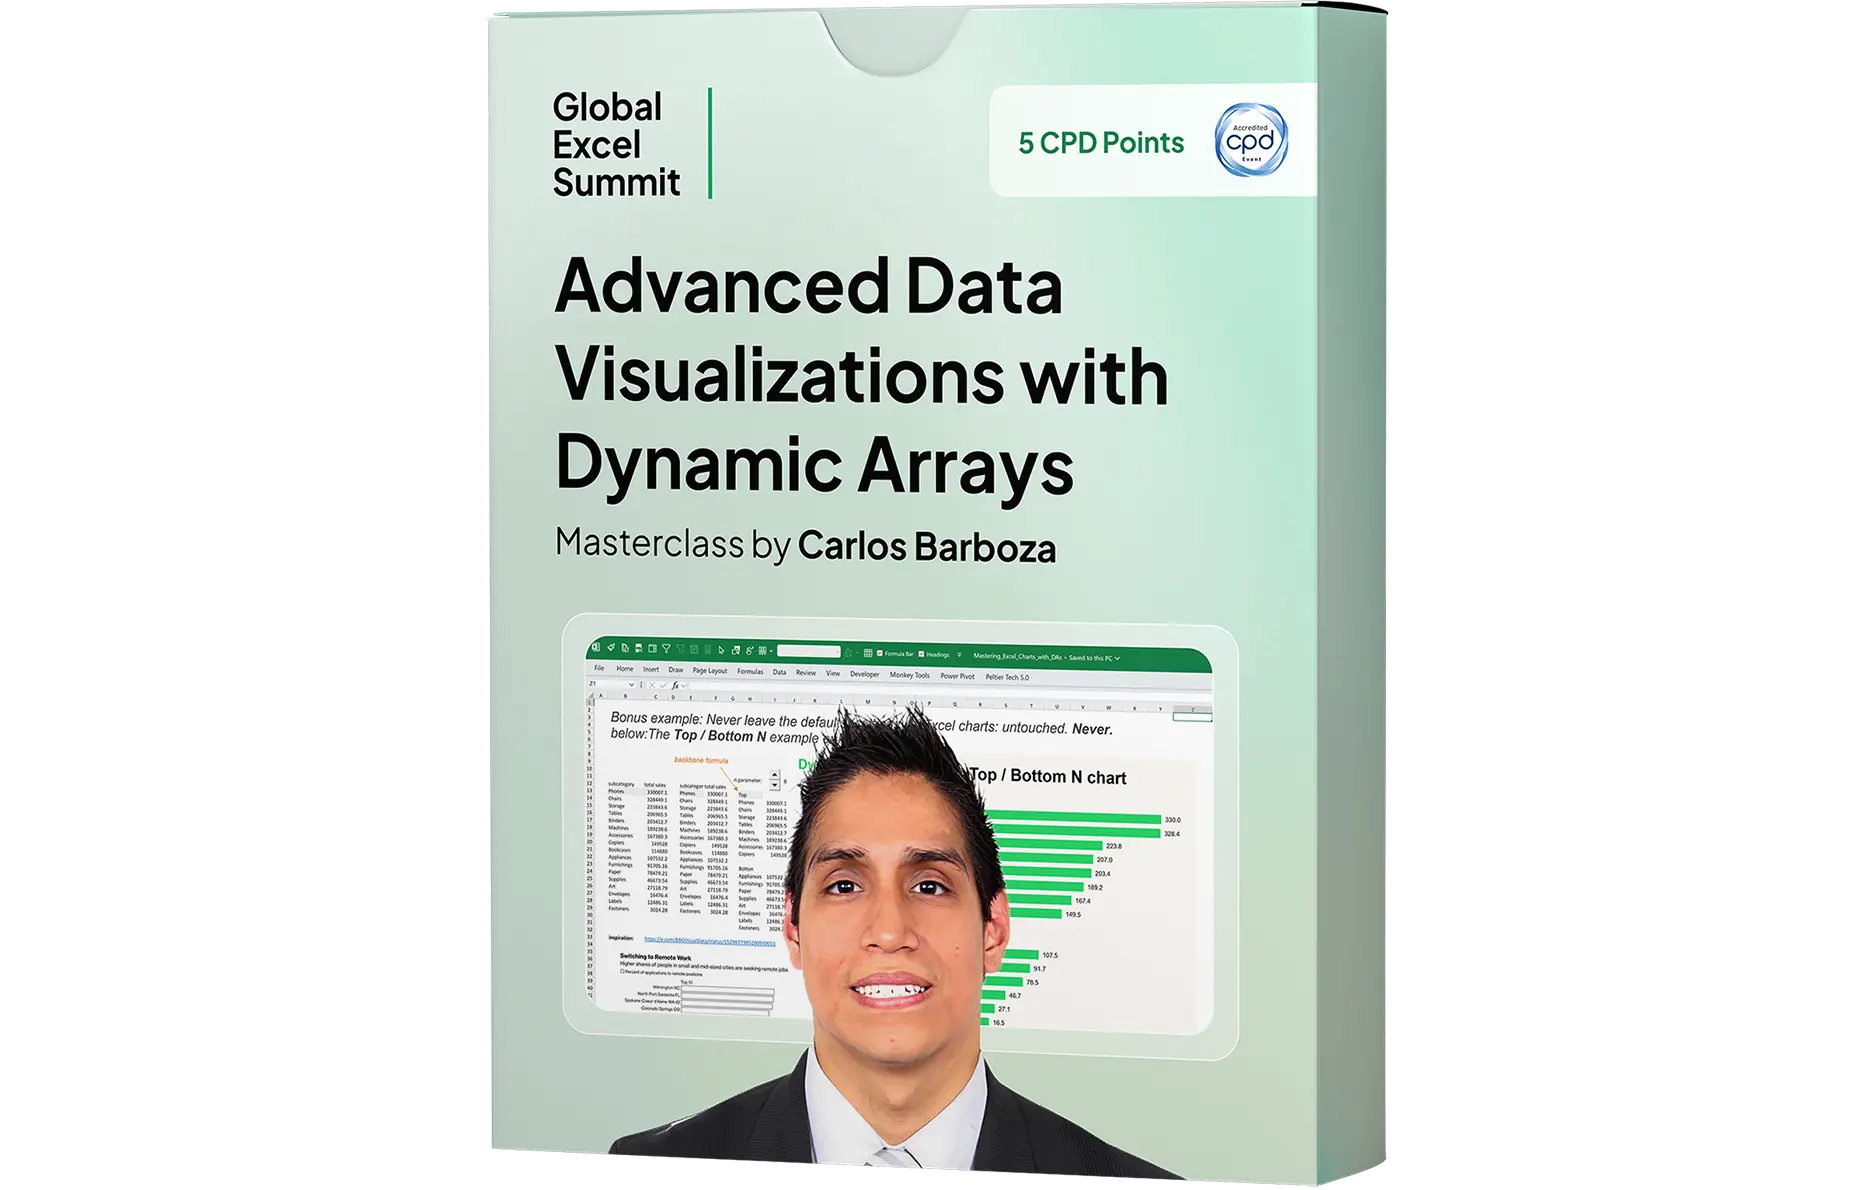
Advanced Data Visualizations with Dynamic Arrays


With the arrival of Excel’s new calculation engine, dynamic arrays and beautifully spilled ranges, the grid awakens with new possibility. What was once static becomes fluid. What was manual becomes alive.
We are no longer confined to the native chart gallery. With intelligent design and clever workarounds, we can bend Excel to our will, crafting charts that respond, evolve, and interact.
This masterclass is an invitation to go beyond the defaults. Unlock the full expressive power of advanced charting techniques fused with dynamic spilled ranges. Start building advanced visualizations that don’t just display data but converse with it.
If you’re ready to move from competent to masterful, from functional to elegant, this is where your next chapter in Excel begins.
What you’ll learn?
- How to engineer fully dynamic charts using Excel’s new calculation engine
- How to transform static charts into interactive analytical tools
- How to design scalable “backbone formulas” that power advanced visuals
- How to integrate Power Query with dynamic arrays for clean, controlled inputs
- How to enhance Excel’s chart defaults for executive-ready storytelling
What's included
Who is it for
This Masterclass is perfect for Excel power users, analysts, and finance professionals who want to turn static charts into dynamic, interactive visualizations powered by modern Excel.
The typical roles that benefit from this course are:
- Excel power users ready to push beyond default charting
- Financial analysts and FP&A professionals building recurring reports
- Data analysts creating dashboards and performance visualizations
Download Course Brochure
Course contents
About your trainer

Carlos Barboza
Carlos Barboza is a Microsoft MVP who simply considers himself a data analyst with more than 10 years of experience working with data cleaning it, modelling it, and then plotting it through graphical displays that support data-driven decision making. He is both very crafty with Microsoft Excel and Power BI and is an independent data consultant who runs the vlog in English: spilledgraphics.com.
What people think of
Carlos Barboza

Once you see the magic, you cannot unsee it.
JUST DO IT! Any finance person who works with data must take this course.

This is gold!!!
Training requirements
- To make the most out of this Masterclass, attendees will need to have some working experience with Excel’s user interface
- Users will require a Windows PC running Excel 2021, or Excel 365
- Attendees should join with a curious mind to learn cool stuff
Buy ticket
Buy 365-Day Digital Masterpass
If you continue experiencing issues, you can send it to us via email to info@globalexcelsummit.com
.gif)
Join the Master Club
Your exclusive all-access pass to our entire digital learning experience for a whole year.
.png)